Assessment of coastal land use and land cover change (2016-2022) in the Gulf of Mottama, Myanmar
To better understand the ecosystem dynamics in the Gulf of Mottama, IUCN Myanmar office used 10-m resolution Sentinel 2 images to map land cover in April 2016 and in April 2022. This work was done as part of the SDC Gulf of Mottama Project, which IUCN is implementing in collaboration with HELVETAS and Network Activities Group (NAG).
Photo: Ground truth survey by drone © Helvetas and IUCN Myanmar
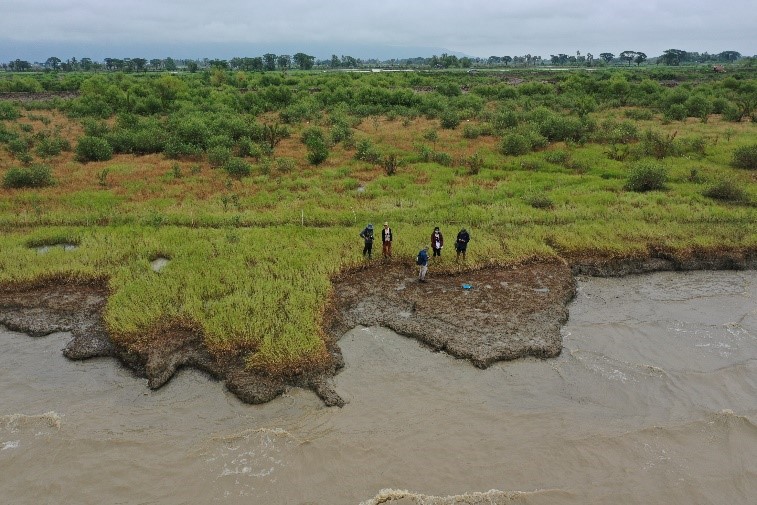
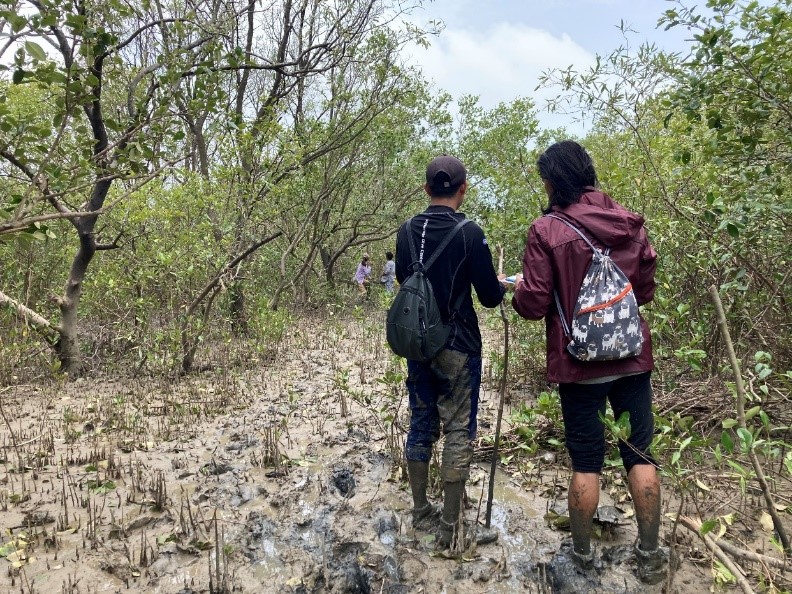
Photo: Ground truth survey in mangroves, Chaungzone township © Helvetas and IUCN Myanmar
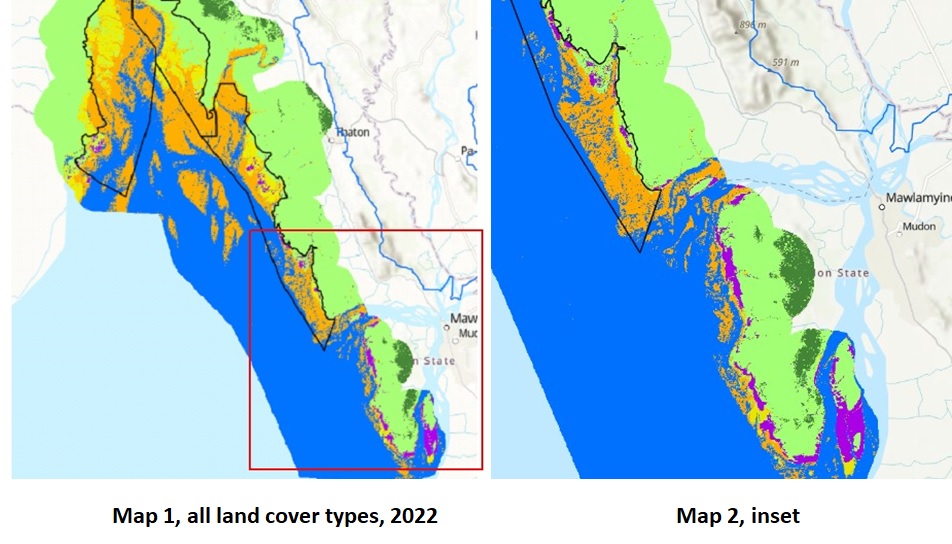
Map 1 shows land cover in 2022: water (blue), mudflat (beige), grassland (yellow), mangrove (purple), cropland (light green), forest (dark green). Map 2 shows the largest areas of mangroves, which are confined to small patches of forest in the southeastern part of the gulf where the water is more saline and currents less strong. The Ramsar site boundary is shown in black.
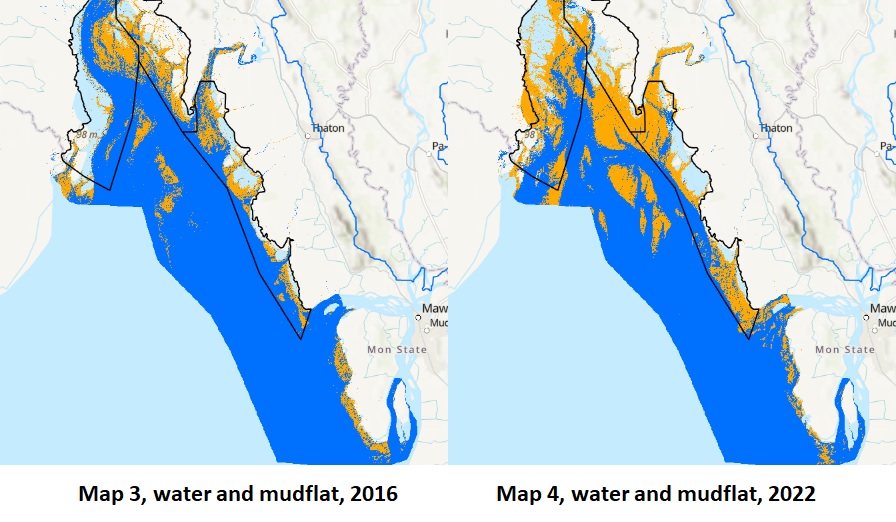
Between 2016 and 2022 (Maps 3-4), the area of mudflat increased from 51,000 to 98,000 hectares. Since erosion and deposition are assumed to be in balance over the long-term, the difference is assumed to be primarily due to the difference in tide height when the images were captured.
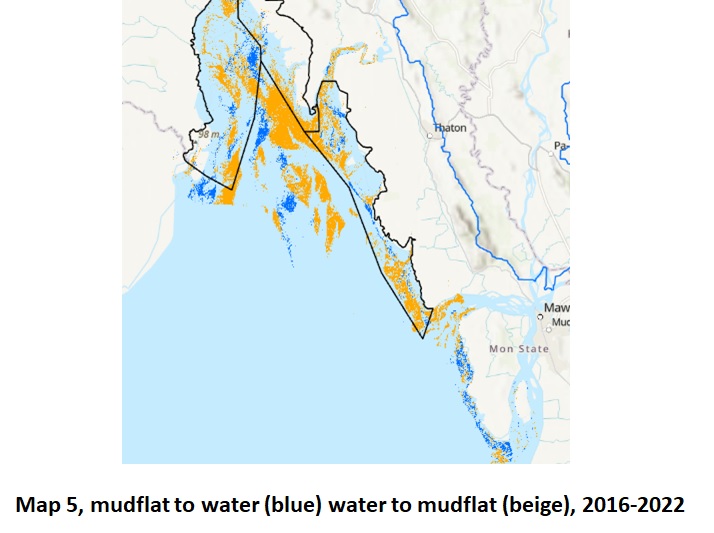
Map 5 shows areas that were mudflat in 2016 and water in 2022 (blue) and water in 2016 and mudflat in 2022 (beige). Large areas of new land were formed on the eastern side of the gulf (Mon State) and were lost on the western side (Bago Region) where several villages have disappeared over the last few years. This pattern of deposition and erosion, which results in rapid land accretion and erosion, is driven by long-term shifts in the main channel of the Sittaung River, which enters the northern end of the gulf.
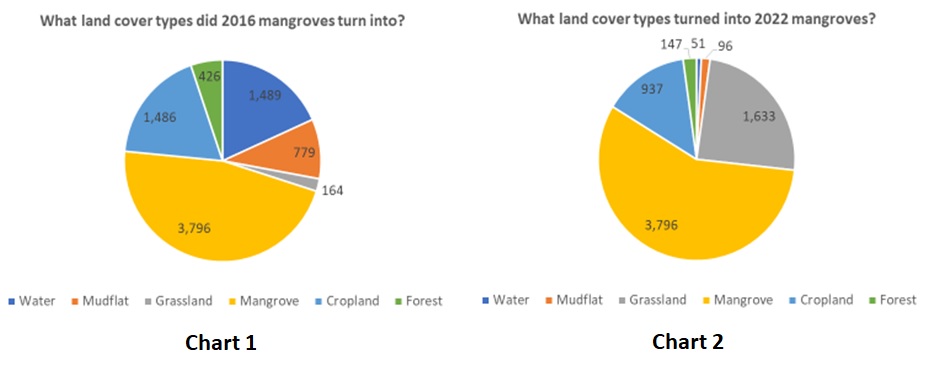
The table shows changes in hectares between the six land cover types between 2016 and 2022. Total (2016/2022) show the area of the land cover in that year. For example, there were 8,140 hectares of mangrove in 2016 and 6,660 hectares in 2022, a reduction of 18%.
|
Hectares |
Water |
Mudflat |
Grassland |
Mangrove |
Cropland |
Forest |
Total (2016) |
|
Water |
194,882 |
52,020 |
7,379 |
51 |
2,228 |
15 |
256,575 |
|
Mudflat |
13,133 |
26,538 |
8,414 |
96 |
2,916 |
7 |
51,104 |
|
Grassland |
3,491 |
9,492 |
7,320 |
1,633 |
13,243 |
182 |
35,360 |
|
Mangrove |
1,489 |
779 |
164 |
3,796 |
1,486 |
426 |
8,140 |
|
Cropland |
1,963 |
9,501 |
4,720 |
937 |
174,895 |
3,537 |
195,553 |
|
Forest |
15 |
28 |
22 |
147 |
8,204 |
18,852 |
27,267 |
|
Total (2022) |
214,973 |
98,358 |
28,019 |
6,660 |
202,972 |
23,018 |
573,999 |
The table shows that of the 8,140 hectares of mangrove in 2016, only 47% remained in 2022: 18% was converted to water (probably because a higher tide in 2022 submerged young mangrove) and 18% to cropland. These changes are show in Chart 1. The conversion to cropland, while small (1,486 hectares), is potentially significant in terms of reducing the area of mudflat available for mud crab collection, a high-value livelihood of particular importance to landless families.
The table also allows the reverse analysis. Chart 2 shows that of the 6,660 hectares of mangrove in 2022, 57% (3,976 hectares) were also mangrove in 2016. The remaining new mangrove came primarily from grassland (25%) and cropland (14%). These changes reflect the very dynamic nature of the gulf’s land cover in response to both natural and human forces.