New technology can help map species on the IUCN Red List
A novel method incorporating remote sensing data into species mapping demonstrates how the IUCN Red List of Threatened Species continues to evolve, increasing in accuracy and impact as new technologies emerge.

Purplish-mantled Tanager (Iridosornis porphyrocephala)
Photo: © Natalia Ocampo-Peñuela
A long-standing limitation to conservation has been our poor understanding of where species live. Geography is destiny: some places are more dangerous for wildlife than others. Those species that live in only a few small places encroached by humans are especially vulnerable.
The last decade has seen an explosion in the availability of data about the planet, especially that collected by satellite remote sensing, for example on elevation and on land cover. Scientists have proposed a variety of approaches applying these new data to mapping species distributions, using a range of different analytical techniques and terminologies.
In this month’s issue of “Trends in Ecology and Evolution”, researchers led by Dr Thomas Brooks, Chief Scientist at the International Union for Conservation of Nature (IUCN), synthesise these approaches into a method to derive a high-resolution map of where a species might live, called its “Area of Habitat”.
“Calculation of Area of Habitat allows us to zoom in from the broad scale range maps provided on the IUCN Red List of Threatened Species,” said Dr Stuart Pimm, Doris Duke Professor of Conservation Ecology at Duke University, the co-lead of the study. “This 'cookie-cutting' yields finer resolution spatial data on where a species’ potential habitat is on the ground”.
The IUCN Red List includes information about species’ habitat and elevation for all assessed species, along with a low resolution range map. Calculating Area of Habitat requires linking the habitat data to remotely sensed land cover data, and linking these to maps of elevation. Thus, a species’ Area of Habitat is the area within the specified land cover and the specified elevation, within the range.
The technique has already been applied to generate Area of Habitat maps for more than 20,000 species of mammals, birds, and amphibians, combining data from the IUCN Red List of Threatened Species with remotely sensed data. The study brought together numerous other scientists involved in such work, from institutions spanning five continents: the IPÊ-Instituto de Pesquisas Ecológicas in Brazil; Duke Kunshan University in China; the Wildlife Trust of India; Università di Roma La Sapienza in Italy; the University of Stellenbosch in South Africa; ETH Zürich and IUCN in Switzerland; BirdLife International, the Royal Society for the Protection of Birds, and the Zoological Society of London in the UK; and Microsoft and Stony Brook University in the USA.
“Building on these advances, the next step is to use the extraordinary wealth of data from citizen science initiatives and museums to quantify the accuracy of the newly developed Area of Habitat models and to ensure they are fit for purpose,” said Dr Stuart Butchart, Chief Scientist at BirdLife International.
Mapping Area of Habitat is not just a scientific exercise: it is also important and timely for conservation policy and practice. In November 2020, the world’s governments will meet in Kunming, China, to negotiate a “post-2020 biodiversity framework” to safeguard and recover life on Earth. This framework will welcome contributions from all sectors of society towards halting biodiversity loss, and advancing restoration.
“Mapping the Area of Habitat is not only important for understanding the current distribution of species. Coupling this information with scenarios of land use change allows us to project the plausible change in habitat available to species in the future. By applying this technique to alternative plausible futures, we can support key policy decisions on the conservation of biological diversity,” said Dr. Carlo Rondinini, Research Scientist at Sapienza University of Rome and Coordinator of the Global Mammal Assessment.
“Area of Habitat maps are important to guide management of any given area of land in ways which benefit, rather than damage, the species living there,” said Thomas Brooks. “This information will be crucial in supporting governments and other institutions in developing science-based targets for biodiversity under the post-2020 biodiversity framework.”
You can access the full article here.
Related content
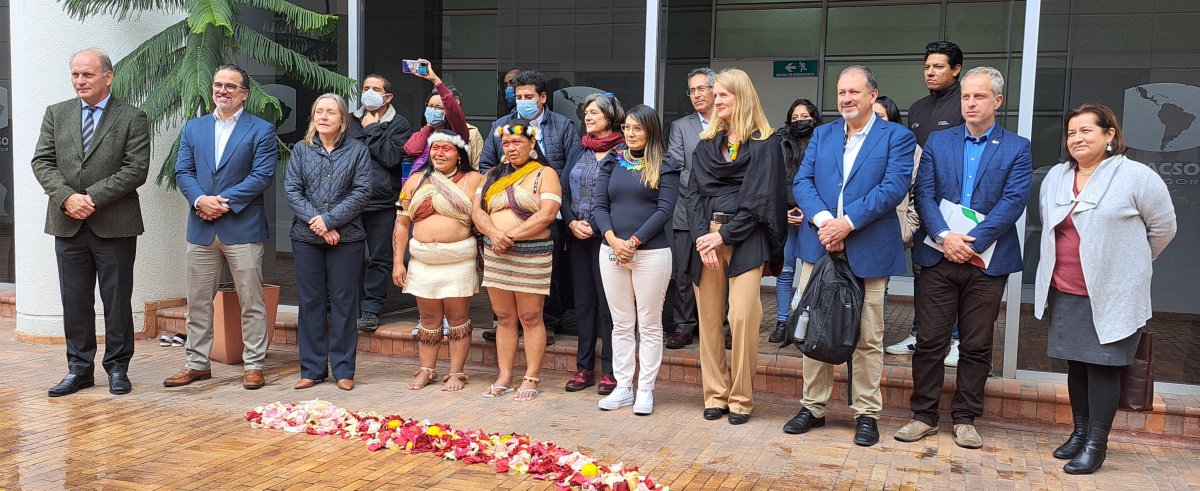
La Oficina Regional de la UICN para América del Sur se unió este año a la celebración de la Semana...
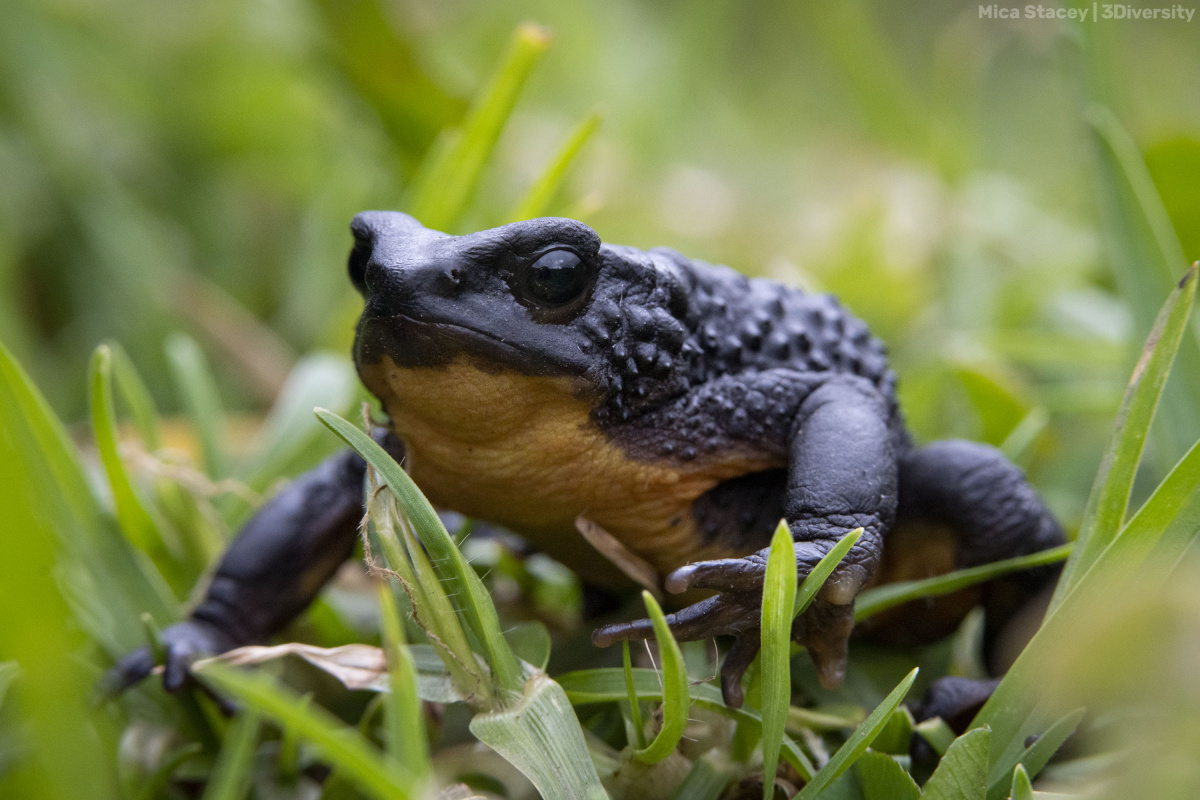
Cinco años después del redescubrimiento del Atelopus ignescens, emblemática especie de rana...

El pasado 25 de abril de 2022 se llevó a cabo un taller de la herramienta en la Universidad San...

Suscríbase a un boletín de la UICN.